BlueAdmiral.com
|
BlueAdmiral.com |
|
| Data Warehouses |
| Introduction There are two distinct types of DB application: The production application which usually
involves short transactions which need to be processed quickly
to update the DB. For example, to process an order or to update
a stock list. For these applications, speed of response is important
and they work best when the DB is as small as possible. Can we do both types of application on the same DB? Basically, the answer to this is no, although it would be possible to a limited extent. You could try to do both with a typical OLTP system which could be set up to perform updates on-line and take care of queries during off-hour batch processing. Long, analytical reports could be run overnight because running them reduces the performance of the production transaction. However, for complex analytical queries
the DB needs to be organised differently from an OLTP DB. Hence
the need for a Data Warehouse. For example, suppose you were interested
in analysing the company's sales revenue. So, investigations can escalate and lead into all sorts of areas which you might not originally have thought about. Data in a DW comes mainly from production
systems but could also include data from other sources. For example: Drawbacks of current applications (before DW) The data hunter/gatherer: What do I want?
The future (we hope!!) The information analyst: I wonder why that
happened?
Description It should now becoming clear what a DW is. Basically, it is large repository of information gathered from many sources. This information should be stored using a single schema at a single site. Data will be stored for a long period of time, thus allowing a historical perspective. The DW provides the user with a single consolidated interface to the data he/she may require and this makes writing decision-support queries easier. A DW does not normally support OLTP. There are a number of issues that need to
be considered when developing a DW. Here are a few:
Components of a DW 1. A data store
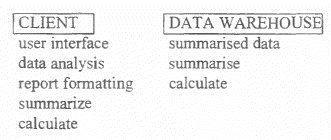
Perhaps ideally, a DW should collect and store all the data relevant to the company eg customers, products, sales, personnel, suppliers etc. etc. However, in practice this may make the DW so large that it is difficult to implement and would take too long. Consequently, some companies have started by building DWs based on one section of the company - perhaps the Marketing Department are only interested in customers. products and sales or perhaps the North region are best supported by having a DW that incorporates all data relevant to their geographic area. This approach allows the company to begin receiving the benefits of a DW sooner than if they had attempted to build a large and complex enterprise DW. These DWs built for a restricted domain are sometimes called Data Marts. Data marts can be restricted to a particular type of input data, a particular business unit, a particular geographic area and so on. However, there are obvious difficulties in trying to bring together these individual DWs at a later date to try to form the enterprise DW. Architecture DW applications are normally built on the client-server principle. In the simplest case, this may be a two-tier structure, with the client performing many of the complex calculations and summaries, as well as managing the user interaction and formatting and reporting the data obtained from the warehouse (a fat' client).
Two-tier architecture
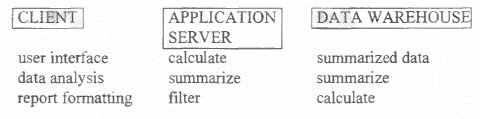
However, it is not unusual to add a third tier, which is an application server between the client and the data warehouse. This server manages the interaction with the warehouse, performs many calculations and sends the results to the client. The addition of the third tier may improve performance and reduce network traffic. Three-tier architecture
There are different types of 3-tier architecture. In one variation the application server acts to facilitate dimensional analysis, which is an important aspect of some data warehouse. This is discussed in more detail later.
Data Quality This is a vital aspect of preparing and managing a DW and also one of the most difficult tasks to achieve.
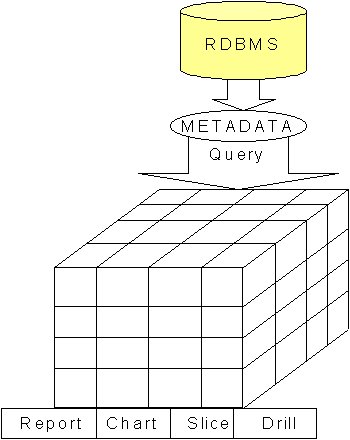
The Metadata repository
Designing a Data Warehouse It is possible to base a DW on an existing relational DB used mainly for transaction processing. As mentioned earlier, this is not a good idea since transaction processing is not really compatible with the complex queries typical of DW use. However, it possible to use the relational
model as the basis of the DW and many of the big names in relational
databases now provide facilities for using their products as data
warehouses. In particular, because of the importance of multi-dimensional
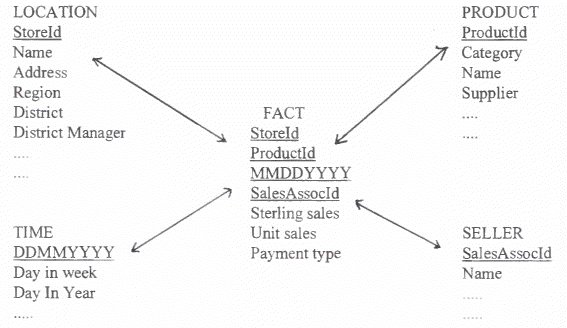
analysis in DWs, there are special tools for this (see later). The star schema. Most relational DB data warehouse applications use a logical database design architecture called a 'star schema'. This consists of a group of tables which describe different aspects of the business grouped around a large central table that contains the key columns of the surrounding tables. The outer tables are called the dimension tables and the large central one is known as the 'fact' table. the purpose of this arrangement is to reduce the number of joins necessary to answer a query. A simple version of a star schema follows:
The Fact table contains the main, basic
business measurements and could consist of millions of rows. The
contents of this table are the values of the business that are
important to analysts such as one of the following: Normally, these rows are loaded in from operational systems. The Dimension tables contain the attributes to be used as search criteria and are usually relatively small. Each table has a fixed number of records, such as lists of products, description of regions of the business, details of time periods, details of customers and so on. The granularity of the fact table is also important. It might be important to analyse orders by market or by product line. Sales may be considered on a monthly basis as well as a daily basis. Hence, the schema might incorporate summary or aggregate data such as roll-ups of products into product categories or customers into regional markets. Should you store aggregate tables or allow
the server to calculate such data when required? The star schema supports SQL statements that retrieve data from the fact table. However, querying the fact table alone is not very flexible and the power of the star schema is using columns from the dimension tables as search criteria for results data in the fact table. The dimension tables allow aggregation and drill down of search criteria using joins. Complex star schemas can have many fact tables and dimension tables. The tables need not be normalised. The advantage of the star schema is that it is relatively simple to understand and creates a picture of the DW that means something to end users in terms of the business itself.
OLAP
querying of the data in such a way that
answers to one query suggests further queries and a thread of
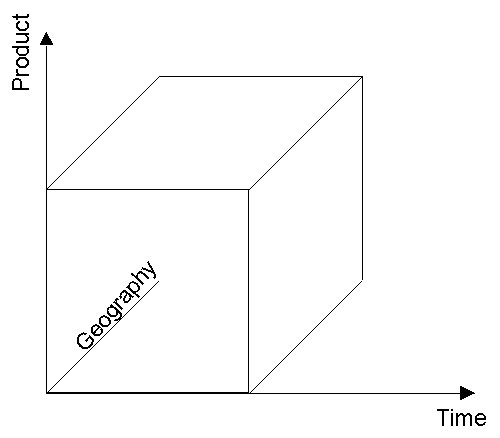
analysis is followed through many passes. Underlying every OLAP tool is the concept of a multidimensional data model. In contrast to OLTP systems, which rely on entities, relationships, functional decomposition, and state transition analysis, the multidimensional model uses constructs such as facts, dimensions, hierarchies, and sparsity. Typically, multidimensional models use numeric values such as values, counts and weights. The idea of dimensions is crucial in this. Dimensions are heterogeneous objects that provide categories for data. For example, the dimensions for a sales analysis may include products, geography and time.
Dimensions are usually related in hierarchies
and a multidimensional DB can have multiple hierarchies. Multidimensional models are frequently represented by the hypercube. This describes an object of three or more dimensions with flat sides and with each dimension at right angles to all the others. This is understandable enough in three dimensions but rather mind-boggling when you try to imagine a hypercube with many dimensions! Analysis using OLAP involves extracting
data for specific dimensions and time periods. For example, find
the gross sales and profits on all product lines by region for
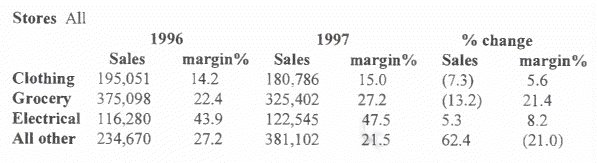
the last three years. The results of OLAP are often shown as cross-tabulations. A 'cross-tab' is a statistical chart that computes some statistic (eg count, sum) for every possible combination of two variables. For example, product against state that shows how many of each product you have sold in each state. A typical cross-tab for a four dimensional model. Three of the dimensions are shown in the table: Department (rows) and Time and Measure (columns). The fourth dimension represents the individual stores - this table is for all stores.
You can also use the result set to drill down (to see additional detail), rolling up (collapsing detail results into higher level summaries) or drilling across (eg by changing regions if one was specified in the original query). The complex queries used would be challenging in SQL and most multidimensional products use specialized languages and GUI front-ends.
OLAP architecture (1) Multidimensional DB servers designed
to optimize the storage of multi-dimensional data. (2) Relational DBs may be used with multidimensional
support. In type (a), the tools provide graphical
building interfaces and send SQL to the RDBMS server. The problem
with these desktop OLAP tools is that most of the analytical work
is done on the client, usually in local memory, which can be a
constraint. For type (b), usually referred to as 3-tiered
(see earlier), there are metadata repositories that store definitions
of the dimensions and their mappings to relational tables, hierarchy
relationships between dimensions, formulae and calculations. The
engines receive requests from the client tools, translate them
into one or more SQL queries, obtain data from the RDBMS, perform
multidimensional processing and return the result to the client. There are many variations on these basic themes. Mercury (from Business Objects) use what they call a dynamic microcube. This is a local multidimensional data store that the microcube builder automatically creates every time new data is received on the client PC.
When a user launches a query, the query generator uses the metadata to create the SQL statements required for locating the desired data. When the raw results are returned from the database, a microcube is automatically created and filled with data optimised for reporting and analysis NB. There is difference between the concept of a multidimensional database and multidimensional analysis. The term OLAP can be associated with different architectures.
Hardware Requirements These depend to a large extent on the size of the DW, the complexity of the queries that must be answered and so on. Relatively small systems can be built with a RDBMS and end-user tools such as Business Objects. However, for larger databases some form of parallel system will be desirable. Many data mining problems involve large, complex DBs. complicated modelling techniques, and substantial computer processing. In addition to the actual computation. a lot of processing is often necessary to select and reformat data for suitable viewin2 of the results. Without adequate processing power, a complex data mining investigation will come to a halt. One of the key factors in building a data warehouse is scalability - the ability to increase performance by adding processing units in such a way that performance scales linearly. Hardware vendors have taken two main approaches
to the idea of using multiple In fact, there are various gradations of
sharing all or part of the system or sharing
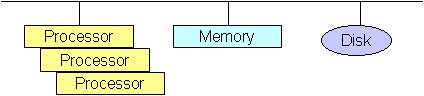
Shared Everything
The advantages of this system are: Shared disc
Advantages are good scalability and load balancing. Also, this type of system is relatively cheap.
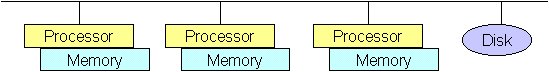
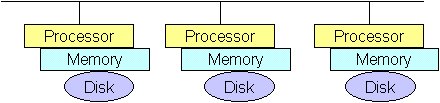
Shared Nothing
o good scalibility This arrangement has good scalability and has relatively cheap component cost. However, it is hard to balance the load. It will also be necessary to keep track of where the data is stored.
Hybrid architecture At the present time, many database vendors are, quite understandably, trying to hedge their bets by providing a range of database software which will run on many types of hardware and perform DW functions as well as support OLTP. Companies are reluctant to invest heavily in completely new hardware and software for data warehousing and try to adapt relational systems to give them some sort of DW. However, it could be argued that current DB technology will not offer an attractive solution to DW needs in future and that, to get the best results, it will be necessary to radically redesign the whole system and take advantage of parallelism.
Further reading Barquin,R and Edelstein,H. (Eds) 1997 Planning and Designing the Data Warehouse Prentice Hall Barquin,R and Edelstein.H. (Eds) 1997 Building,
Using and Managing the Data Many articles in DBMS (eg October 1995)
|